We are interested to see if different compartments of diet behavior and human omics layers of data are connected, if they even are. This project include data processing, analysis, and hypothesis to explain the results and correlations.
The data is composed of microbiome, metabolomics and diet dataset from the COPSAC2010 cohort. This metagenomic data is from shot-gun sequencing, and hence allows for various of levels of information beyond bacterial taxonomy.
The data is organized in a phyloseq object in metagenomics10y.RData.
The taxonomic profiles were generated using MAGinator (Zachariasen, T., Russel, J., Petersen, C., Vestergaard, G.A., Shah, S., Atienza Lopez, P., Passali, M., Turvey, S.E., Sørensen, S.J., Lund, O. and Stokholm, J., 2024. MAGinator enables accurate profiling of de novo MAGs with strain-level phylogenies. Nature Communications, 15(1), p.5734.)
The metagenomic data is in relative abundance.
In sample data and meta data, there are information on the diet from FFQs in the form of :
- Over all:
energiandtotal_amount_consumed - Food groups:
low_fat_milk, ...,cheese - Nutrients:
prot, ...,alkoe - Blood metabolomics from the same visit measured in plasma using NMR:
Total.C, ...,GlycA
All the plots and analysis done can be found in the pdf presentation Small Data Analysis for Integrative Microbiome and Metabolomics.pdf
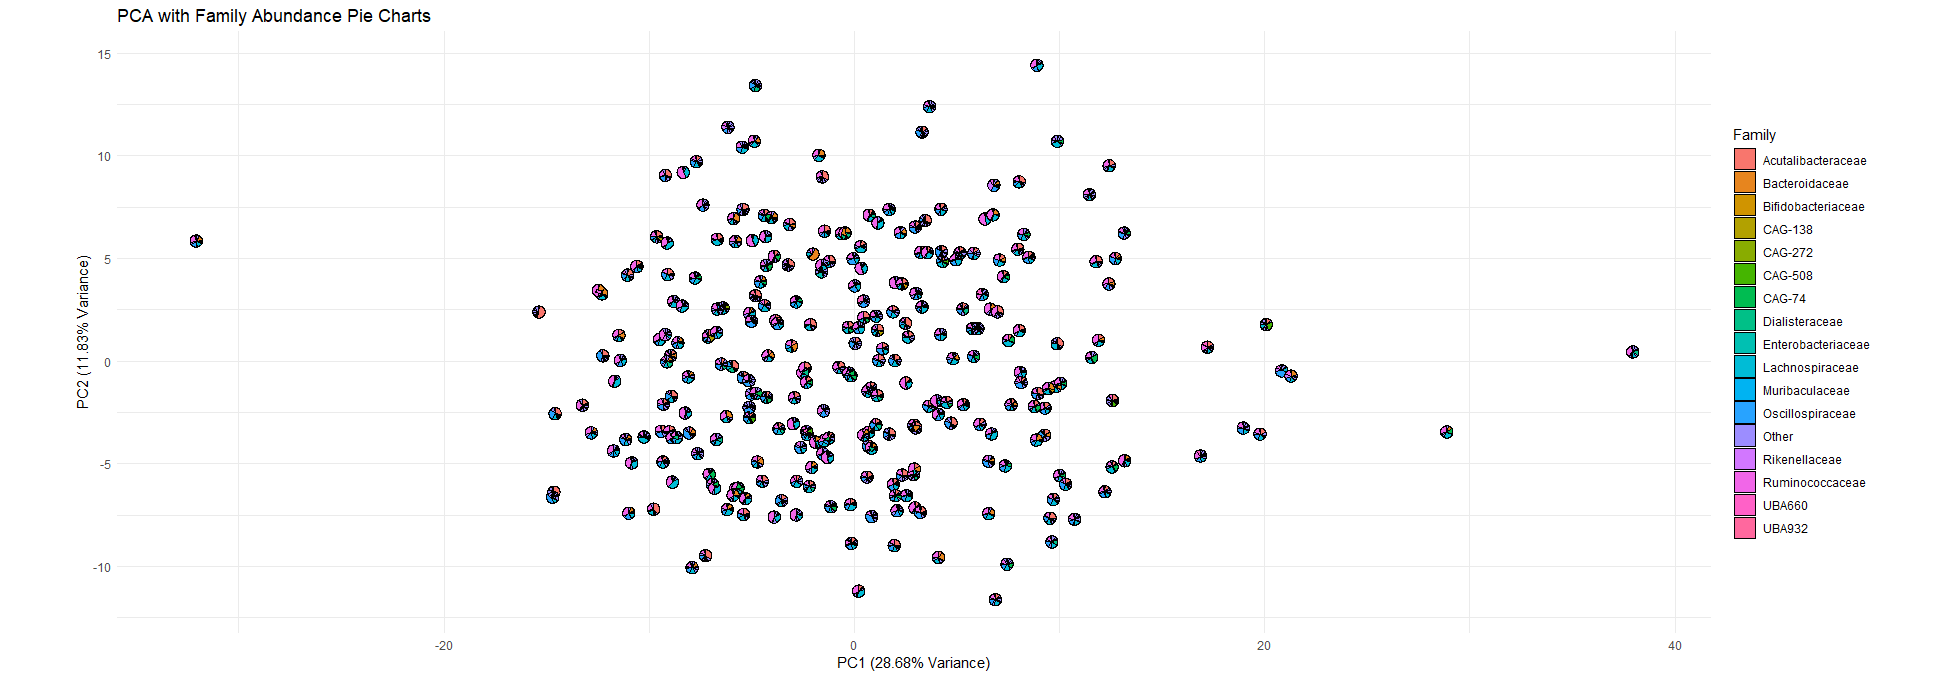
The PCA using all the sample data have a high explained variance (PC1 11,83%, PC2 28,68%)However the features importance shows that the weights of each sample variable is really low (<0.015) for PC1 no features are more important than the others
For the PC2, the weights are a bit higher (around 0.02-0.03 for the highest ones) but explain less variance than PC1.
Overall the PCA needs refining choosing specific sample variables as some might introduce noise that prevent the important features to be detected. (using features selection)
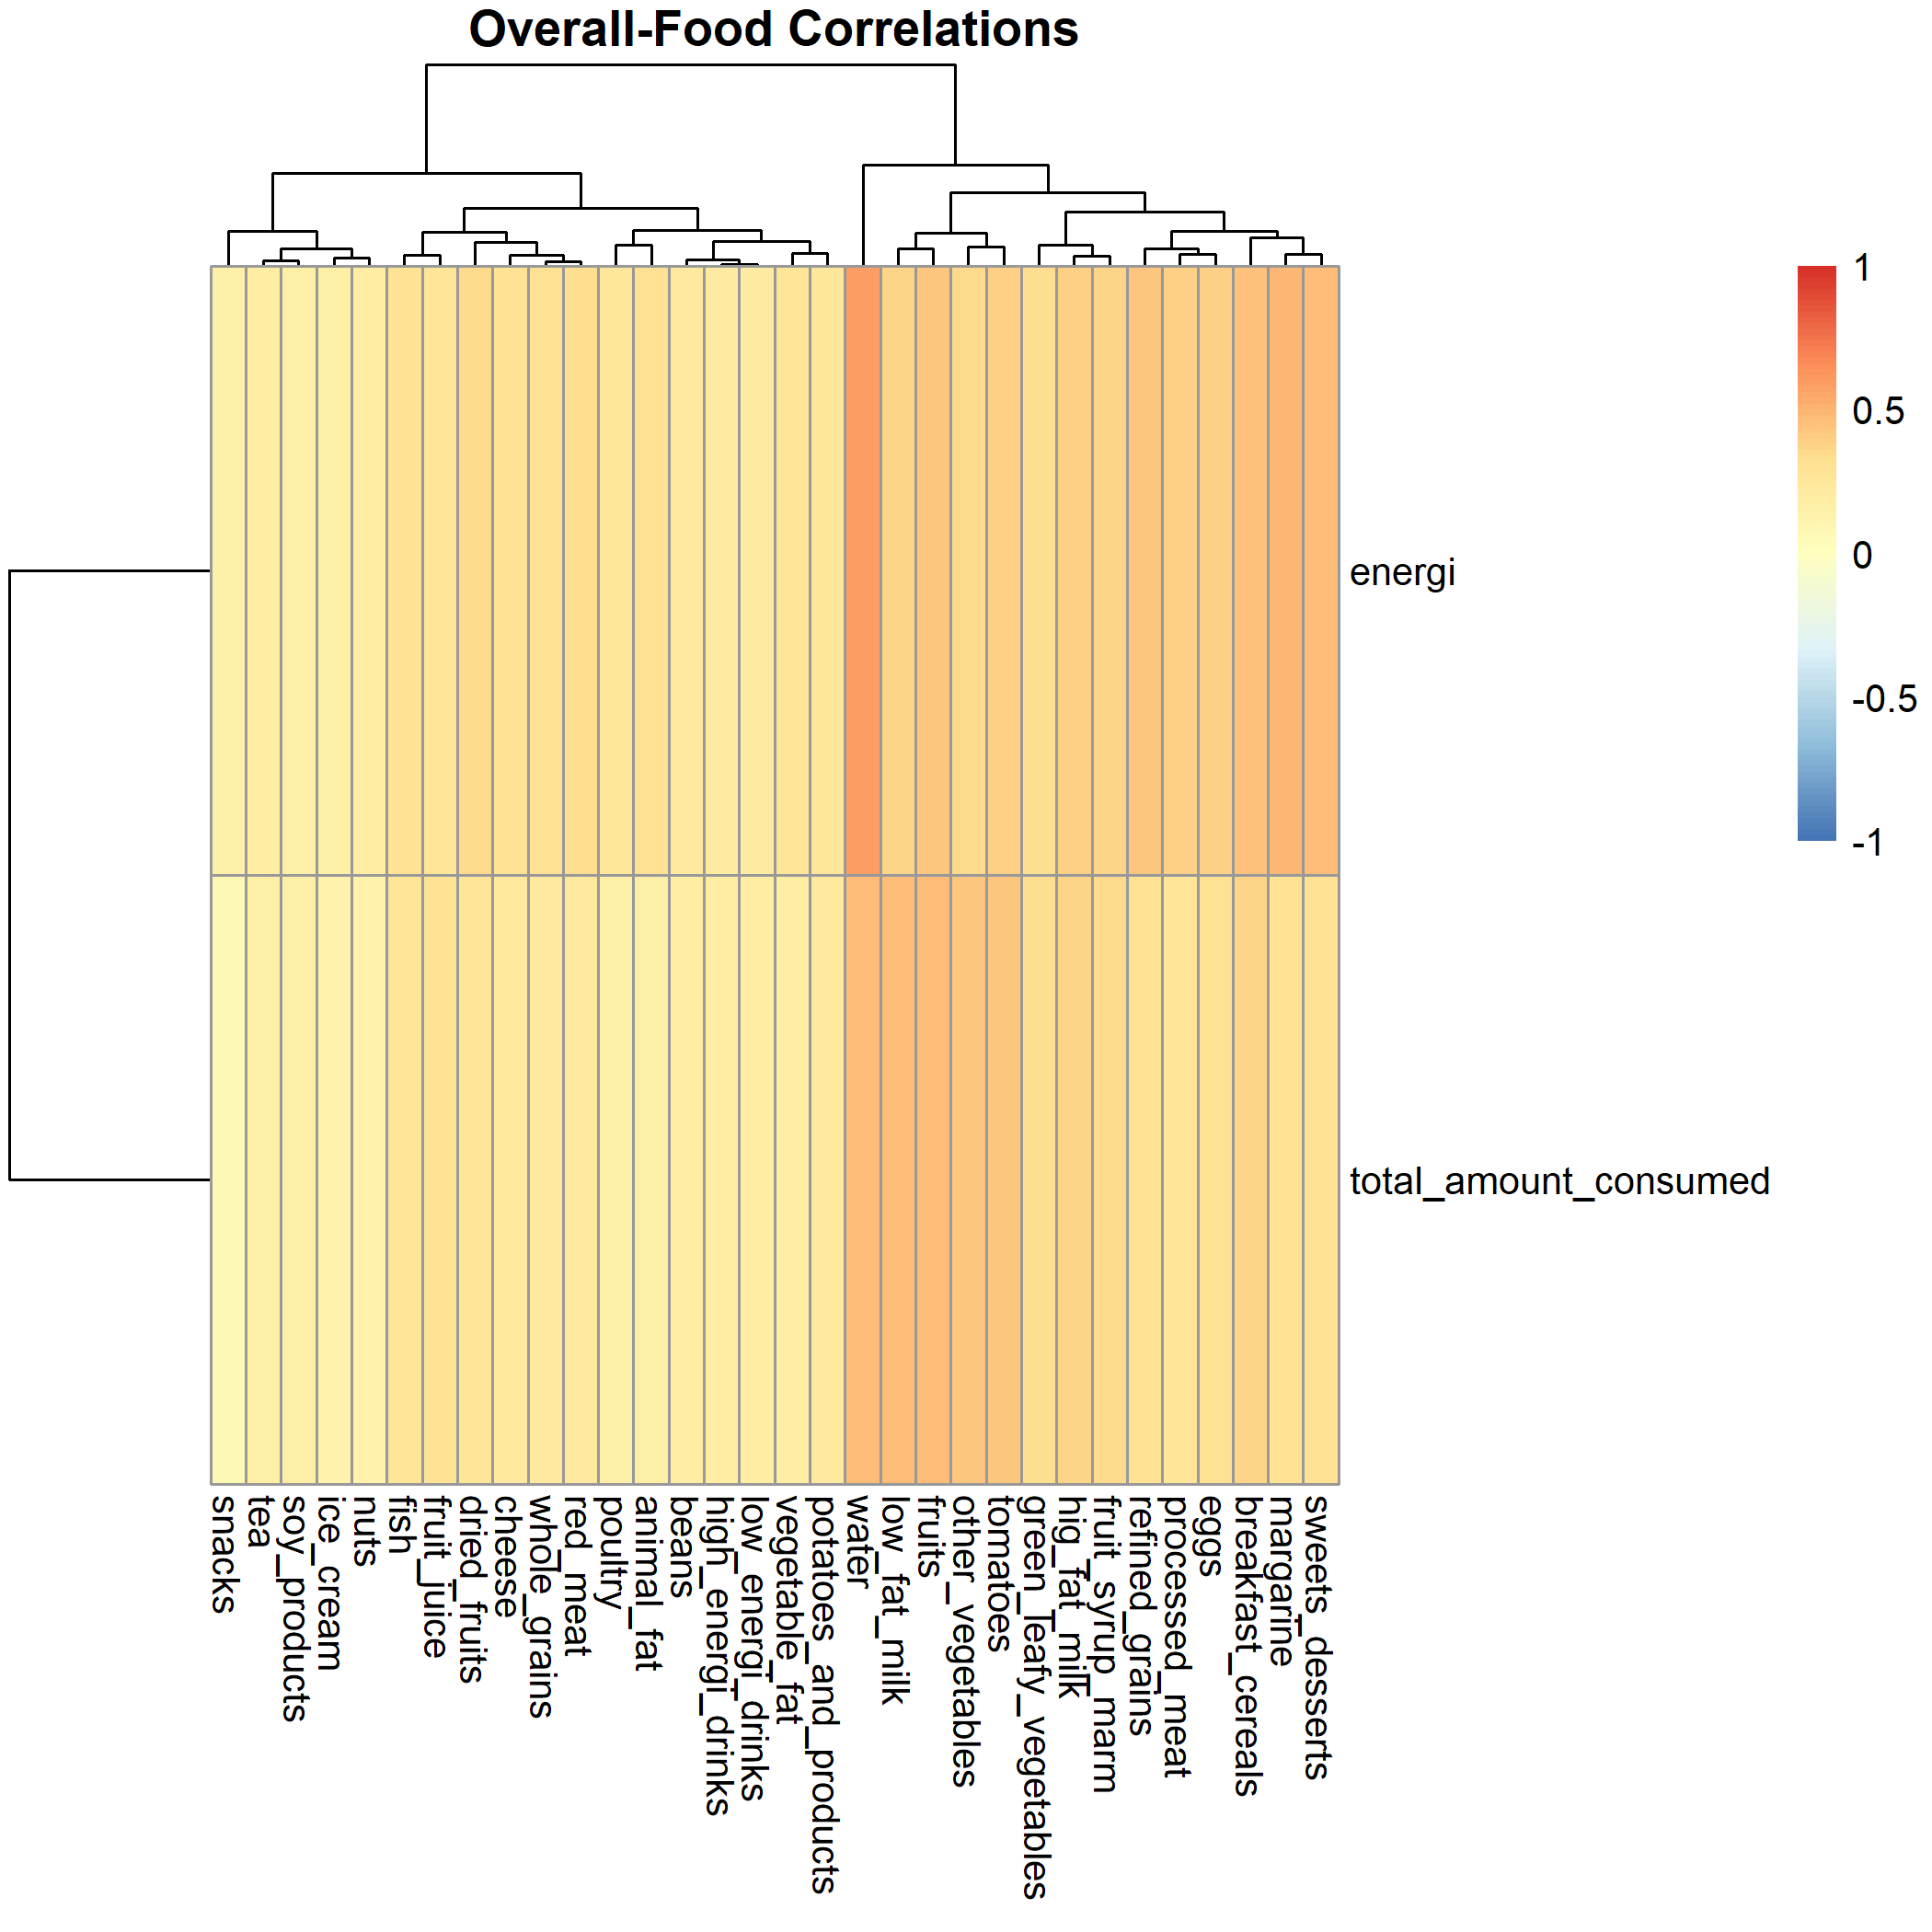
There is high correlation between the overall and food.
This should be investigated more to have a better understanding of the variables that may add the same information and could be removed from the sample data.
The metabolomics on the other end are not correlated at all with the other sample data, and might need more investigation.
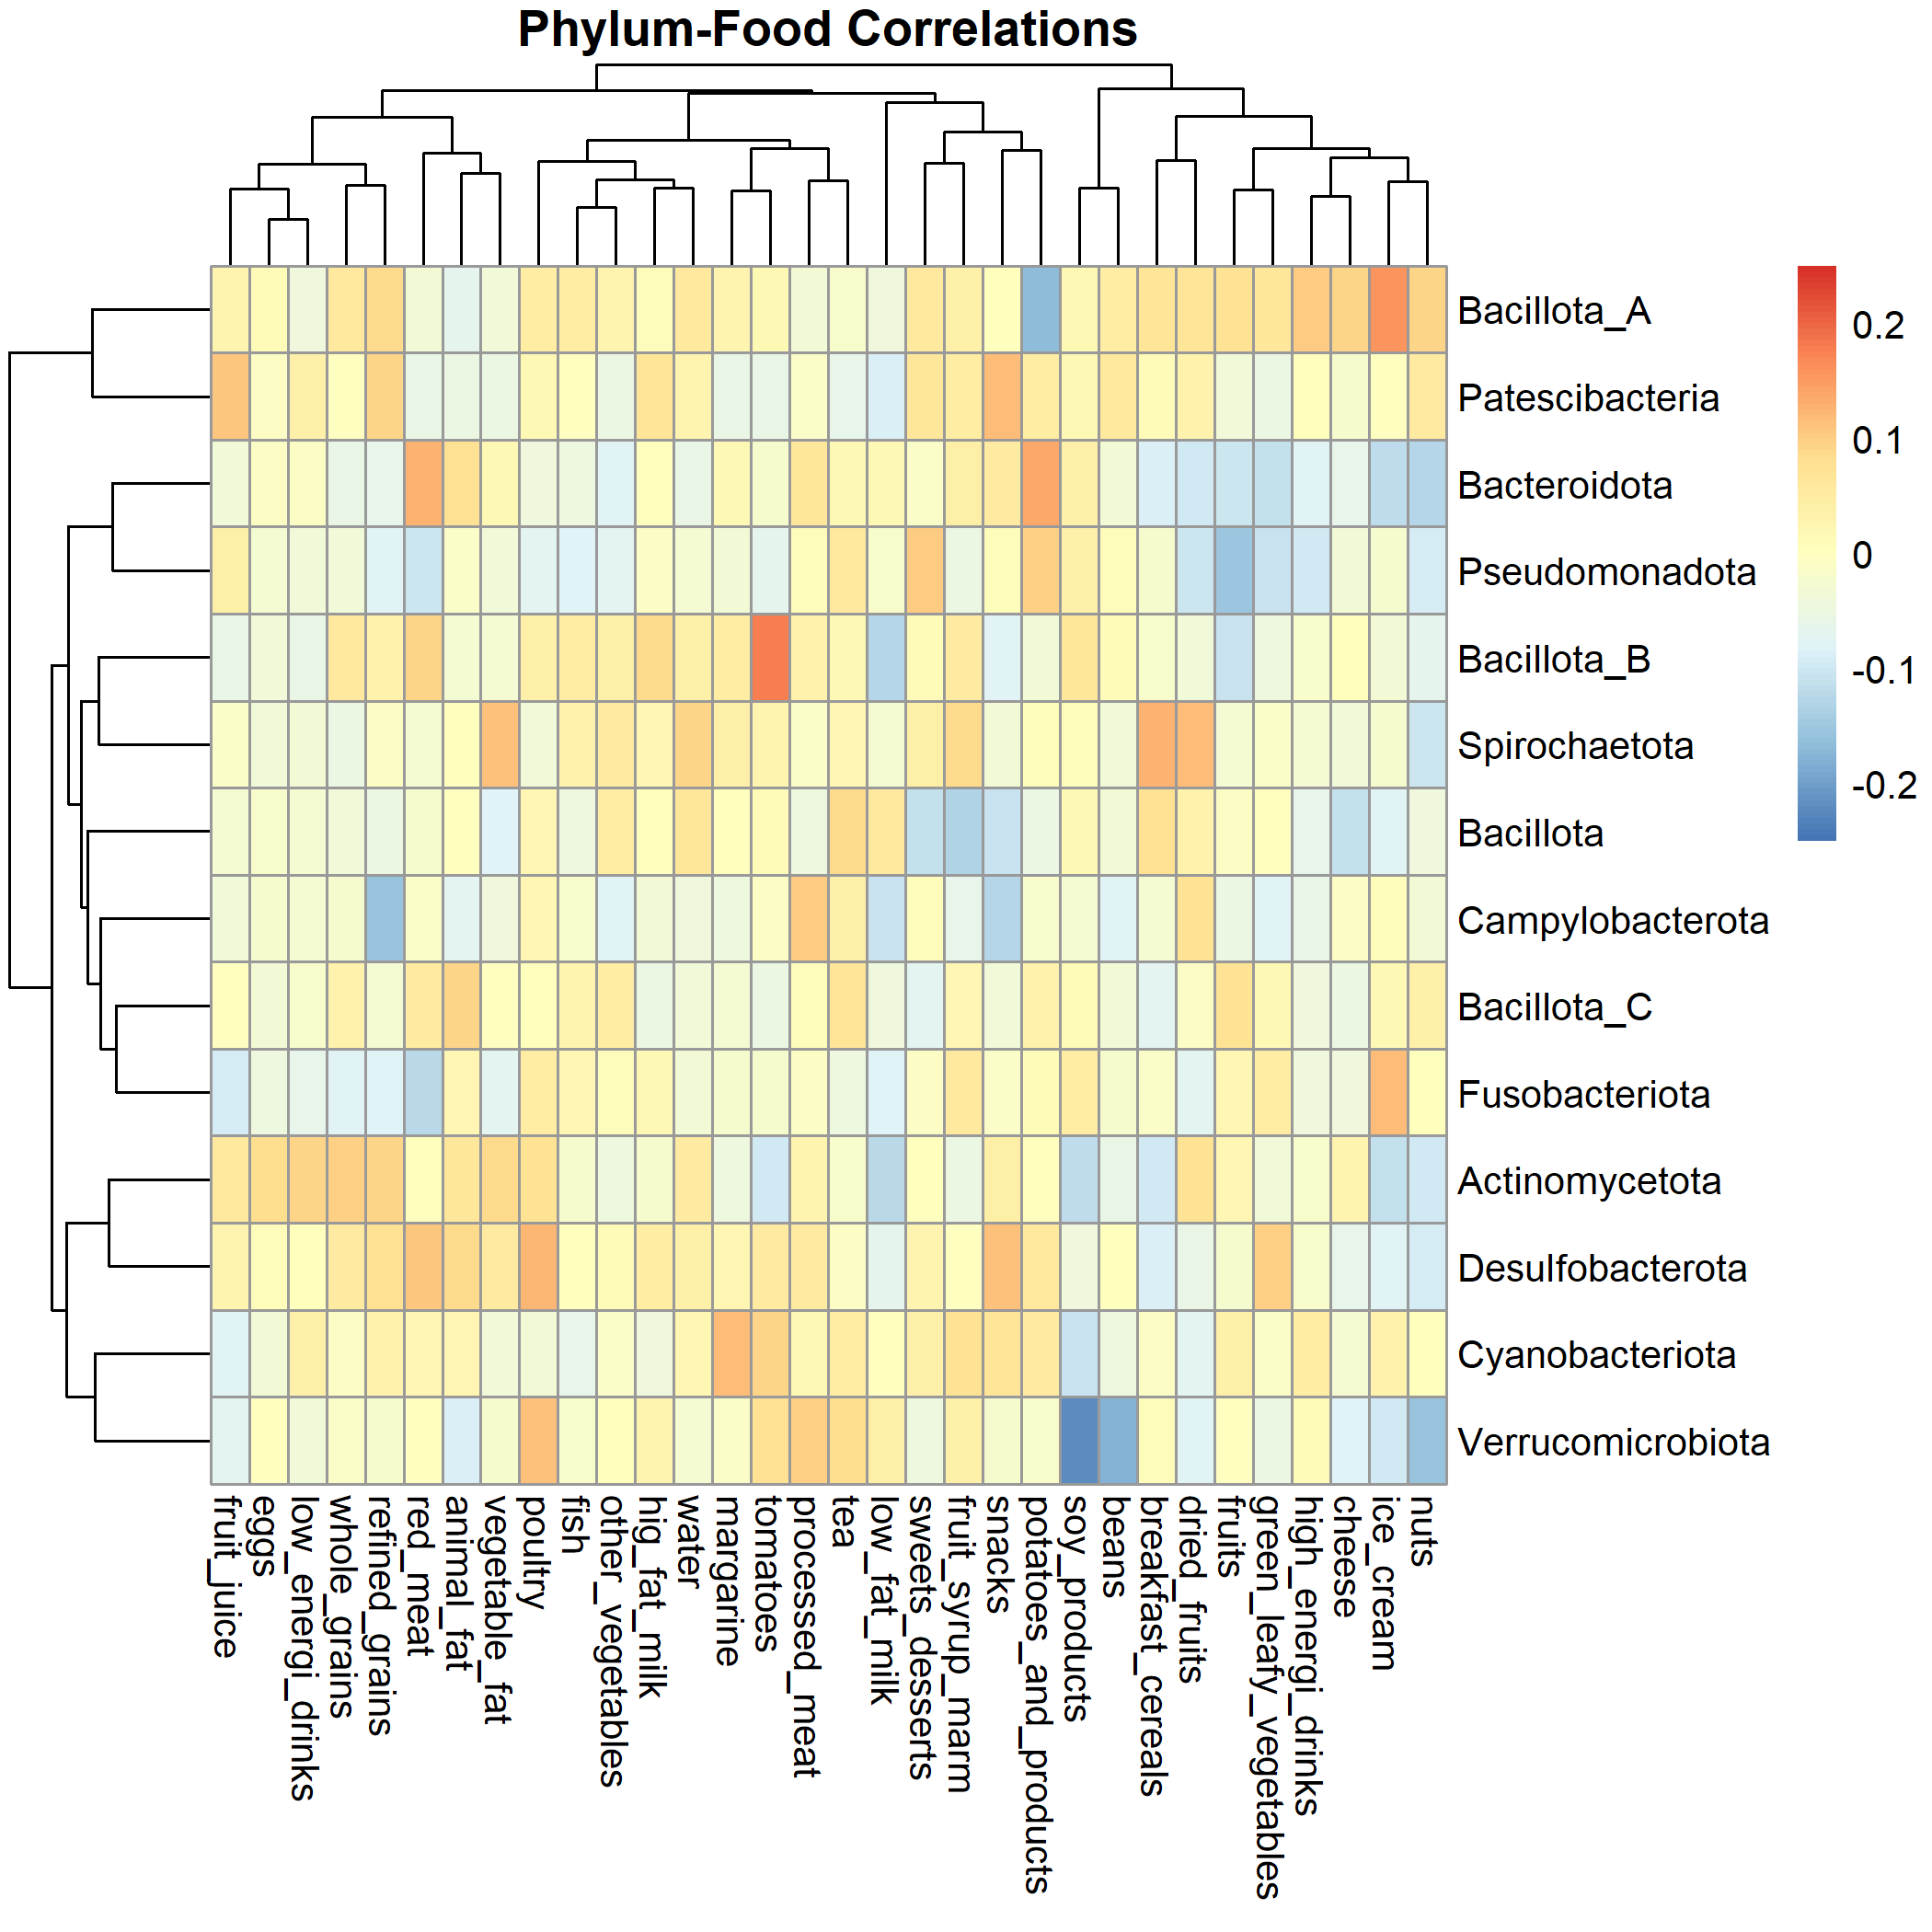
The correlations are pretty low (highest lower than 0.2).
There seems a lot of weak signals that needs to be more investigated mostly on the nutrients and metabolomics as well as on food.