Turn a collection of texts into an interactive narrative graph of entities and their relations and explore the structure of your corpus visually.
pip install narrativegraphsfrom narrativegraphs import NarrativeGraph
docs: list[str] = [...] # your list of documents
model = NarrativeGraph().fit(docs)
model.serve_visualizer()Open the link in your terminal to explore the graph in your browser:
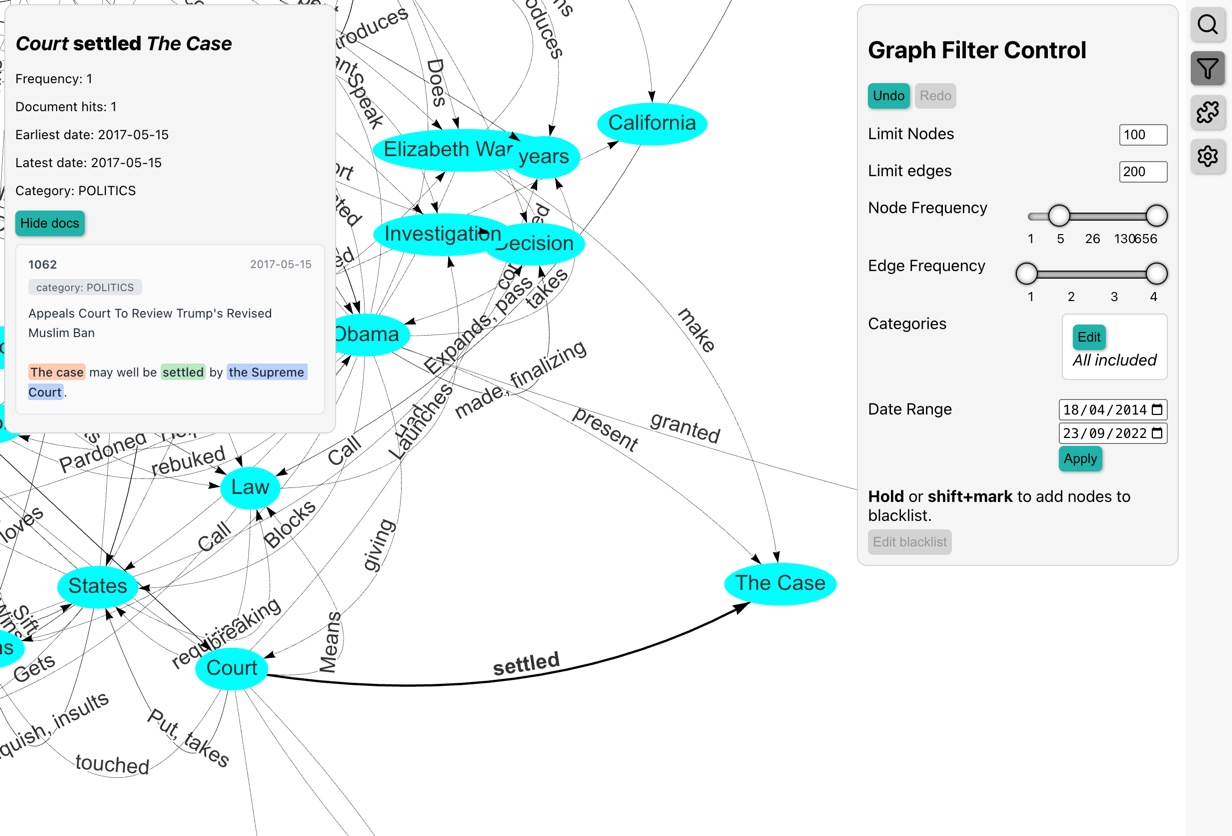
- Plug'n'play solution – get started with a few lines of code
- Interactive browser-based visualizer – shipped with an interactive React app which can be hosted directly from Python, no extra dependencies
- See the original contexts that extracted entities and relations appear in
- Filter and query the graph by statistics, category, or timestamps
- Export graph and data to NetworkX and Pandas for your own custom analyses
- Modular structure – customize or switch out pipeline components to accommodate your use case.
Full documentation and tutorials: kasperfyhn.github.io/narrativegraphs
If you use this package in academic work, please cite:
@software{narrativegraphs,
  author = {Fyhn, Kasper},
  title = {narrativegraphs: A Python package for narrative graph analysis},
  year = {2026},
  url = {https://github.com/kasperfyhn/narrativegraphs}
}