
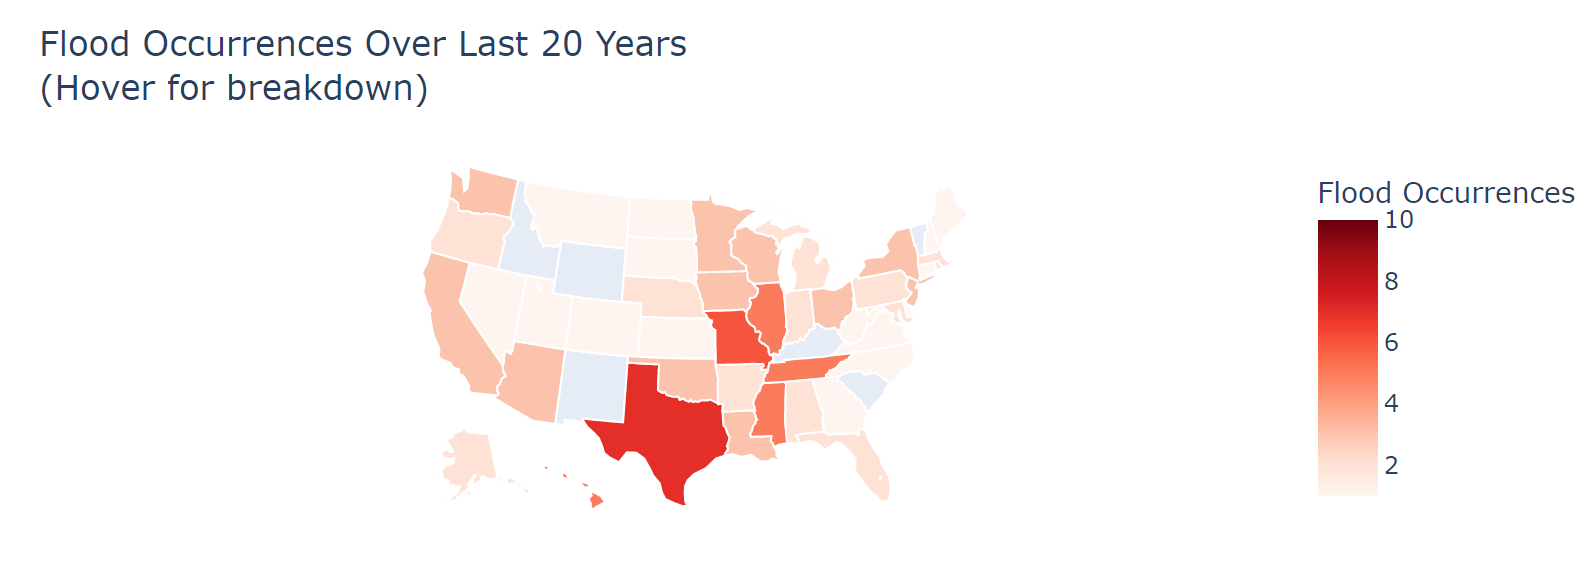
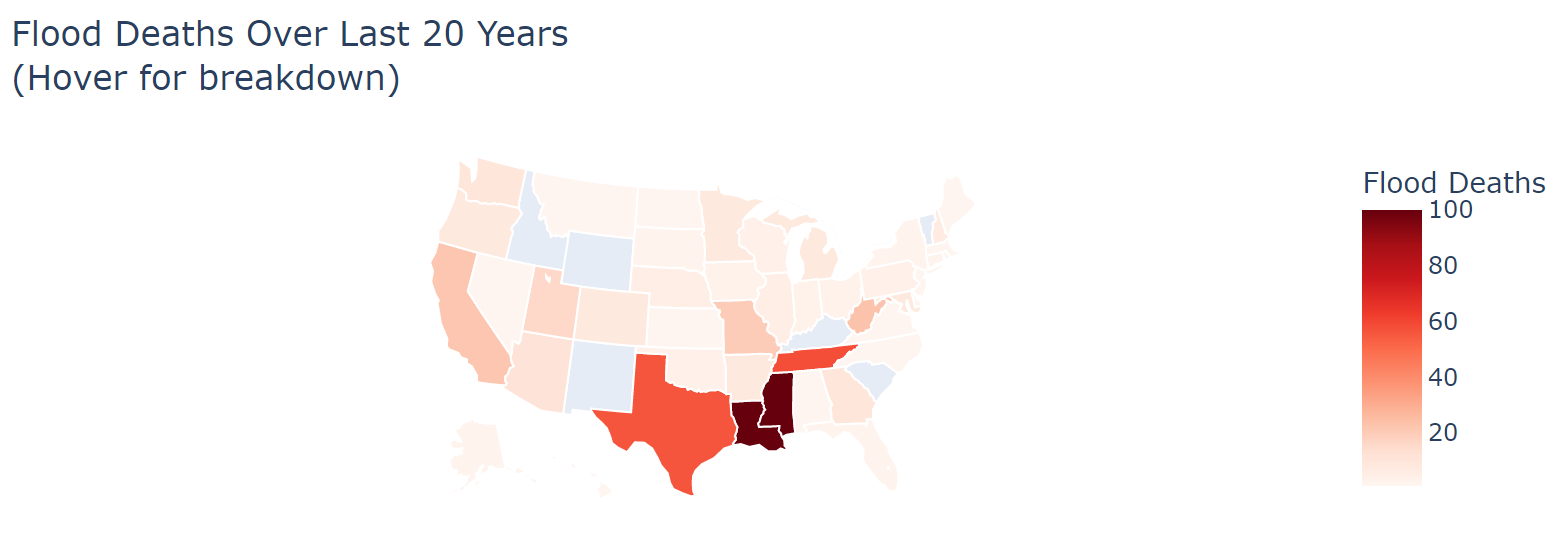
This tool uses plotly to create choropleth maps displaying the amount of flood occurrences and deaths through the years 2000 - 2021 in the United States. By hovering over a specific state, the user can view the amount of occurrences/deaths as a number.
Data was obtained through several sources. Some sources were unavailable and archives of the sources were used instead. Information from the sources and the archives were stored into a CSV file.
Using the data from the CSV, two choropleth maps were created via Plotly. One of the visualizations contain a choropleth for flood deaths in the U.S. And the other visualization contains a choropleth for flood occurrences in the U.S.
Rohan Sazad is a student at CUNY Queens College majoring in Computer Science. He has knowledge in C++ and Python.
Email: [email protected]
LinkedIn: https://www.linkedin.com/in/rohan-sazad-635293217/
- https://www.wpc.ncep.noaa.gov/tropical/rain/paul2000.html
- https://web.archive.org/web/20060723034359/http://www.weather.gov/om/assessments/pdfs/Katrina.pdf
- https://web.archive.org/web/20070812121145/http://newhampshire.com/about-nh/nh-floods-history.aspx
- https://archive.ph/20120904010628/http://www.necn.com/04/02/10/Floodwater-swallows-inventory-at-Warwick/landing.html?blockID=209113&feedID=4215
- https://web.archive.org/web/20110717204144/http://www.crh.noaa.gov/eax/?n=moriverflood_2011
- http://www.cnn.com/2011/US/05/03/missouri.levee.breach/index.html?hpt=Sbin
- https://web.archive.org/web/20110521190827/http://www.mvn.usace.army.mil/bcarre/2011operation.asp
- http://www.johnweeks.com/river_mississippi/pages/lmiss25.html
- https://www.nytimes.com/2013/04/26/us/in-midwest-drought-abruptly-gives-way-to-flood.html?_r=0
- https://archive.today/20130615192431/http://www.kcci.com/weather/hillaker-the-wettest-spring-in-141-years-of-records/-/9358602/20342492/-/towiox/-/index.html
- https://now.uiowa.edu/2013/05/flood-preparations-begin
- https://archive.ph/20130615192331/http://www.icgov.org/apps/news/?newsID=8794
- https://web.archive.org/web/20130614130603/http://www.cbs2iowa.com/news/features/top-stories/stories/corps-opens-gates-coralville-dam-16999.shtml
- https://www.thegazette.com/news/river-crests-in-cedar-rapids-flood-response-holding/
- https://archive.ph/20130616040745/http://www.icgov.org/apps/news/?newsID=8842
- https://www.denverpost.com/2013/09/12/colorado-flood-no-relief-in-sight-as-record-rain-falls/
- https://www.denverpost.com/2013/09/11/colorado-flood-front-range-floodwaters-kill-three-drench-homes/
- https://web.archive.org/web/20160120163300/http://www.denverpost.com/ci_24072743/dam-break-threatens-lyons-residents-warned-go-higher
- https://denver.cbslocal.com/2013/09/13/warning-issued-about-dangerously-high-boulder-creek/
- https://web.archive.org/web/20140813225951/http://news.msn.com/us/flash-flooding-in-new-york
- https://web.archive.org/web/20140814061028/http://news.msn.com/us/new-york-town-gets-entire-summers-worth-of-rain
- https://www.wsj.com/articles/record-breaking-rain-floods-long-island-new-york-region-1407947088
- https://www.reuters.com/article/us-usa-weather-new-york-idUSKBN0GD16020140813
- https://www.usatoday.com/story/weather/2014/08/13/rain-floods-long-island-northeast-wednesday/13994951/
- https://www.nbcnews.com/news/weather/strong-storms-shatter-records-long-island-cars-nearly-submerged-n179546
- https://www.cbsnews.com/newyork/news/flash-flood-watches-warnings-in-effect-as-heavy-rain-drenches-parts-of-tri-state/
- https://www.nydailynews.com/new-york/drivers-rescued-stranded-cars-flooded-long-island-roads-article-1.1901696
- https://www.cbsnews.com/news/woman-dies-after-car-is-swept-in-arizona-flooding/
- https://web.archive.org/web/20150526195450/http://www.accuweather.com/en/weather-news/live-severe-storms-flooding-ra/47679913
- https://www.usnews.com/news/us/articles/2015/05/26/the-latest-recovery-cleanup-set-to-begin-in-texas-mexico
- https://weather.com/safety/floods/news/flooding-news-impacts-plains-midwest
- https://www.shreveporttimes.com/story/news/2016/03/10/flooding-evacuations-continue-caddo-and-bossier-parishes/81602118/
- https://abcnews.go.com/US/houston-mayor-urges-residents-stay-home-severe-flooding/story?id=38481817
- https://web.archive.org/web/20160602235851/http://www.kpax.com/story/32107818/seven-dead-after-record-setting-floods-in-texas-kansas
- https://weather.com/forecast/regional/news/plains-rain-flood-threat-wettest-may-ranking
- https://weather.com/news/weather/news/ellicott-city-maryland-flooding-saturday
- https://www.winknews.com/2017/08/27/flooding-starts-subsiding-residents-left-picking-up-the-pieces/
- https://www.news-press.com/story/news/2017/08/27/flooding-plagues-fort-myers-south-lee-county-areas-rv-resort-evacuated/606119001/
- https://www.winknews.com/2018/08/29/residents-hit-hard-by-2017-flooding-growing-impatient-with-county/
- https://web.archive.org/web/20210211035724/https://www.thebalance.com/hurricane-irma-facts-timeline-damage-costs-4150395
- https://www.nhc.noaa.gov/data/tcr/AL112017_Irma.pdf
- https://www.cbsnews.com/news/ohio-river-flooding-deadly-storms-rain-extreme-weather-today-2018-02-26/
- https://www.courier-journal.com/story/news/local/2018/03/13/ohio-river-flooding-damage-costs-louisville/420550002/
- https://www.courier-journal.com/story/news/2018/09/08/louisville-under-flash-flood-warning-u-l-home-opener/1244907002/
- https://www.courier-journal.com/story/news/crime/2018/09/09/louisville-taxi-driver-drowns-after-flash-floods-sink-car/1247966002/
- https://web.archive.org/web/20190113062903/http://www.prh.noaa.gov/hnl/pages/events/KauaiOahuApril2018Floods/
- https://www.nhc.noaa.gov/data/tcr/EP142018_Lane.pdf
- https://apnews.com/article/eeb07f8c65084ba1845fc42a57ae3d9c
- http://thoughtleadership.aon.com/Documents/20190118-ab-if-december-global-recap.pdf
- https://www.wpc.ncep.noaa.gov/tropical/rain/lane2018.html
- https://www.kxan.com/weather/weather-blog/tropical-storm-imelda-7th-wettest-tropical-cyclone-on-u-s-record/
- https://www.wmbfnews.com/2018/09/25/first-alert-waccamaw-rising-fast-not-cresting-another-hours/
- https://www.usatoday.com/story/news/nation/2020/12/02/southeast-alaska-wettest-day-ever-flooding-mudslides-haines/3803492001/
- https://www.ncdc.noaa.gov/stormevents/
- https://www.cnn.com/2021/03/29/us/nashville-flooding-monday/index.html
- https://weather.com/news/news/2021-03-10-hawaii-flooding-oahu-maui-kauai-evacuations-haleiwa
- https://weather.com/news/news/2021-03-09-hawaii-dam-overflow-evacuations-homes-damaged
- https://www.foxnews.com/us/heavy-rain-brings-flash-flood-emergency-alabama-southeast
- https://www.accuweather.com/en/severe-weather/nearly-a-months-worth-of-rain-in-1-day-deluges-alabama/942728
- https://abcnews.go.com/US/wireStory/flood-threats-persist-storms-continue-drench-south-77501072
- https://www.cnn.com/2021/05/18/weather/flooding-baton-rouge-louisiana-texas/index.html
- https://www.usatoday.com/story/news/nation/2021/05/18/louisiana-flooding-historic-floods-swamp-south-central-u-s/5144289001/
- https://www.nbcnews.com/news/us-news/flooding-louisiana-storms-turns-deadly-n1267886
- https://www.cnn.com/2021/05/19/weather/texas-extreme-weather/index.html
- https://www.fox2detroit.com/news/map-metro-detroit-freeways-closed-saturday-due-to-flooding
- https://philadelphia.cbslocal.com/2021/07/13/philadelphia-bucks-county-weather-severe-storms-bring-dangerous-flooding-to-region/
- https://www.theguardian.com/us-news/2021/jul/16/arizona-floods-flagstaff-state-of-emergency
- https://azdailysun.com/news/local/flagstaff-coconino-county-declare-state-of-emergency-after-homes-outside-fire-area-see-unexpected-flooding/article_f15c6f3b-d08a-5f99-94ca-a0cdbe5bab56.html
- https://www.newschannel5.com/news/flood-related-deaths-in-humphreys-county-rises-to-19