


An open-source profiler plugin for JDK 11+ based on JFR, async-profiler, Firefox Profiler, and Jeffrey.
This plugin supports
- profiling Java applications directly from run configurations using JFR or async-profiler
- attaching to already-running JVMs from the "JFR Recording" tool window — start and stop recordings without restarting the process
- viewing JFR files with Firefox Profiler or Jeffrey (click frames in Jeffrey's flame graph to jump directly to source)
- CPU-time profiling via
jdk.CPUTimeSample(JEP 509) on Java 25+ Linux runtimes - flamegraphs, call trees, function tables, marker timelines, allocation profiles, and more
- MCP toolset for AI assistants (JetBrains AI, GitHub Copilot, Claude Code): list and run configurations
with profiling, open JFR files, start/stop recordings, navigate profiler views, get hot functions,
run
jfr view/jfr printfor tabular analysis, and jump to source — all via MCP tools (requires IntelliJ 2025.2+ with the MCP Server plugin)
This plugin is under active development; feel free to try it and open issues for any bugs or suggestions.
See my blog post Firefox Profiler beyond the web for a detailed description and how I ended up there.
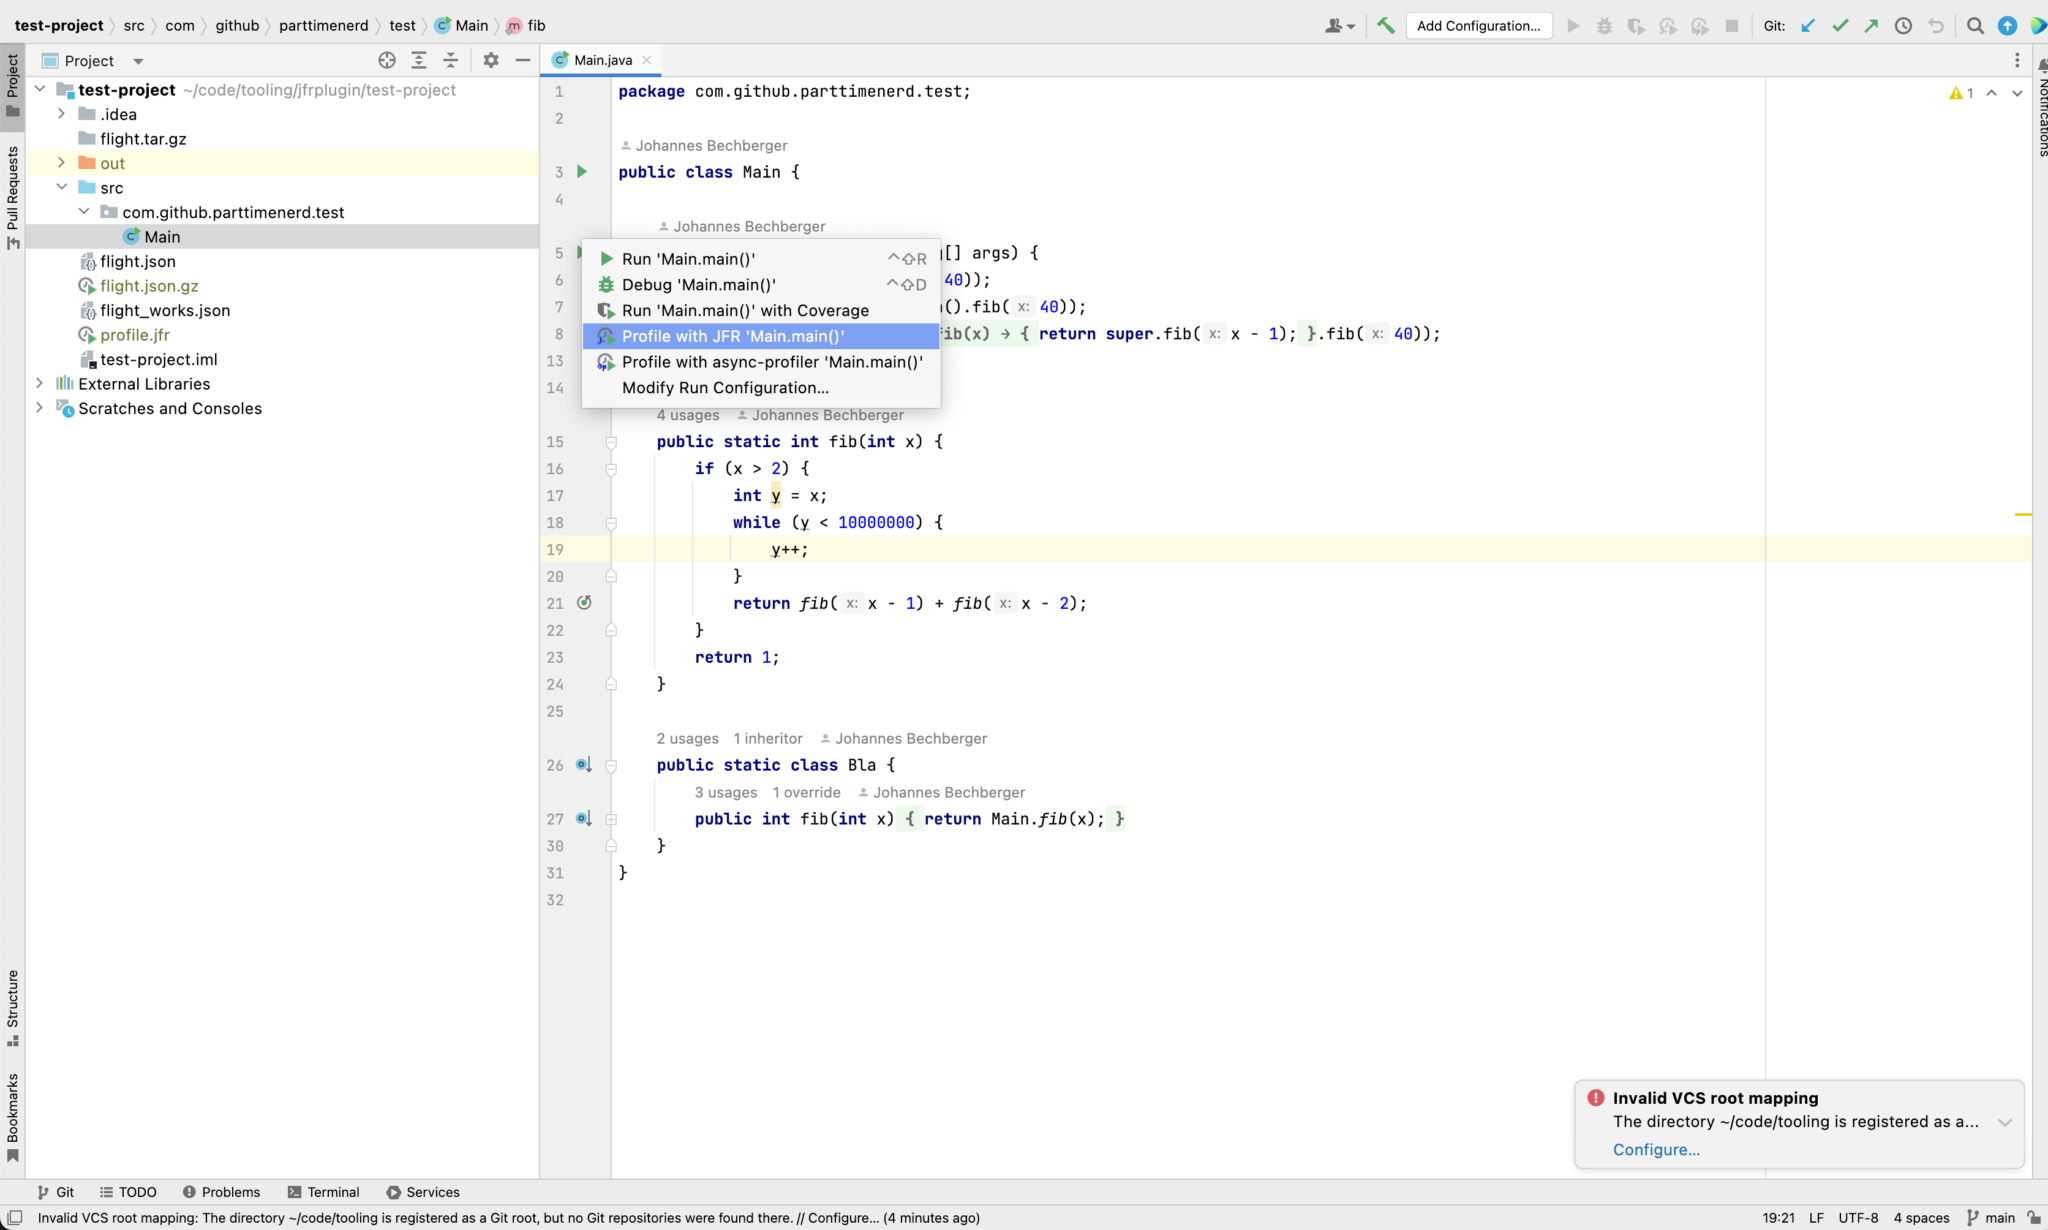
The plugin adds a "Profile with JFR" and "Profile with async-profiler" action to all Java run configurations. After the run finishes the profile opens automatically in the editor.
My plugin adds a context menu for profiling:
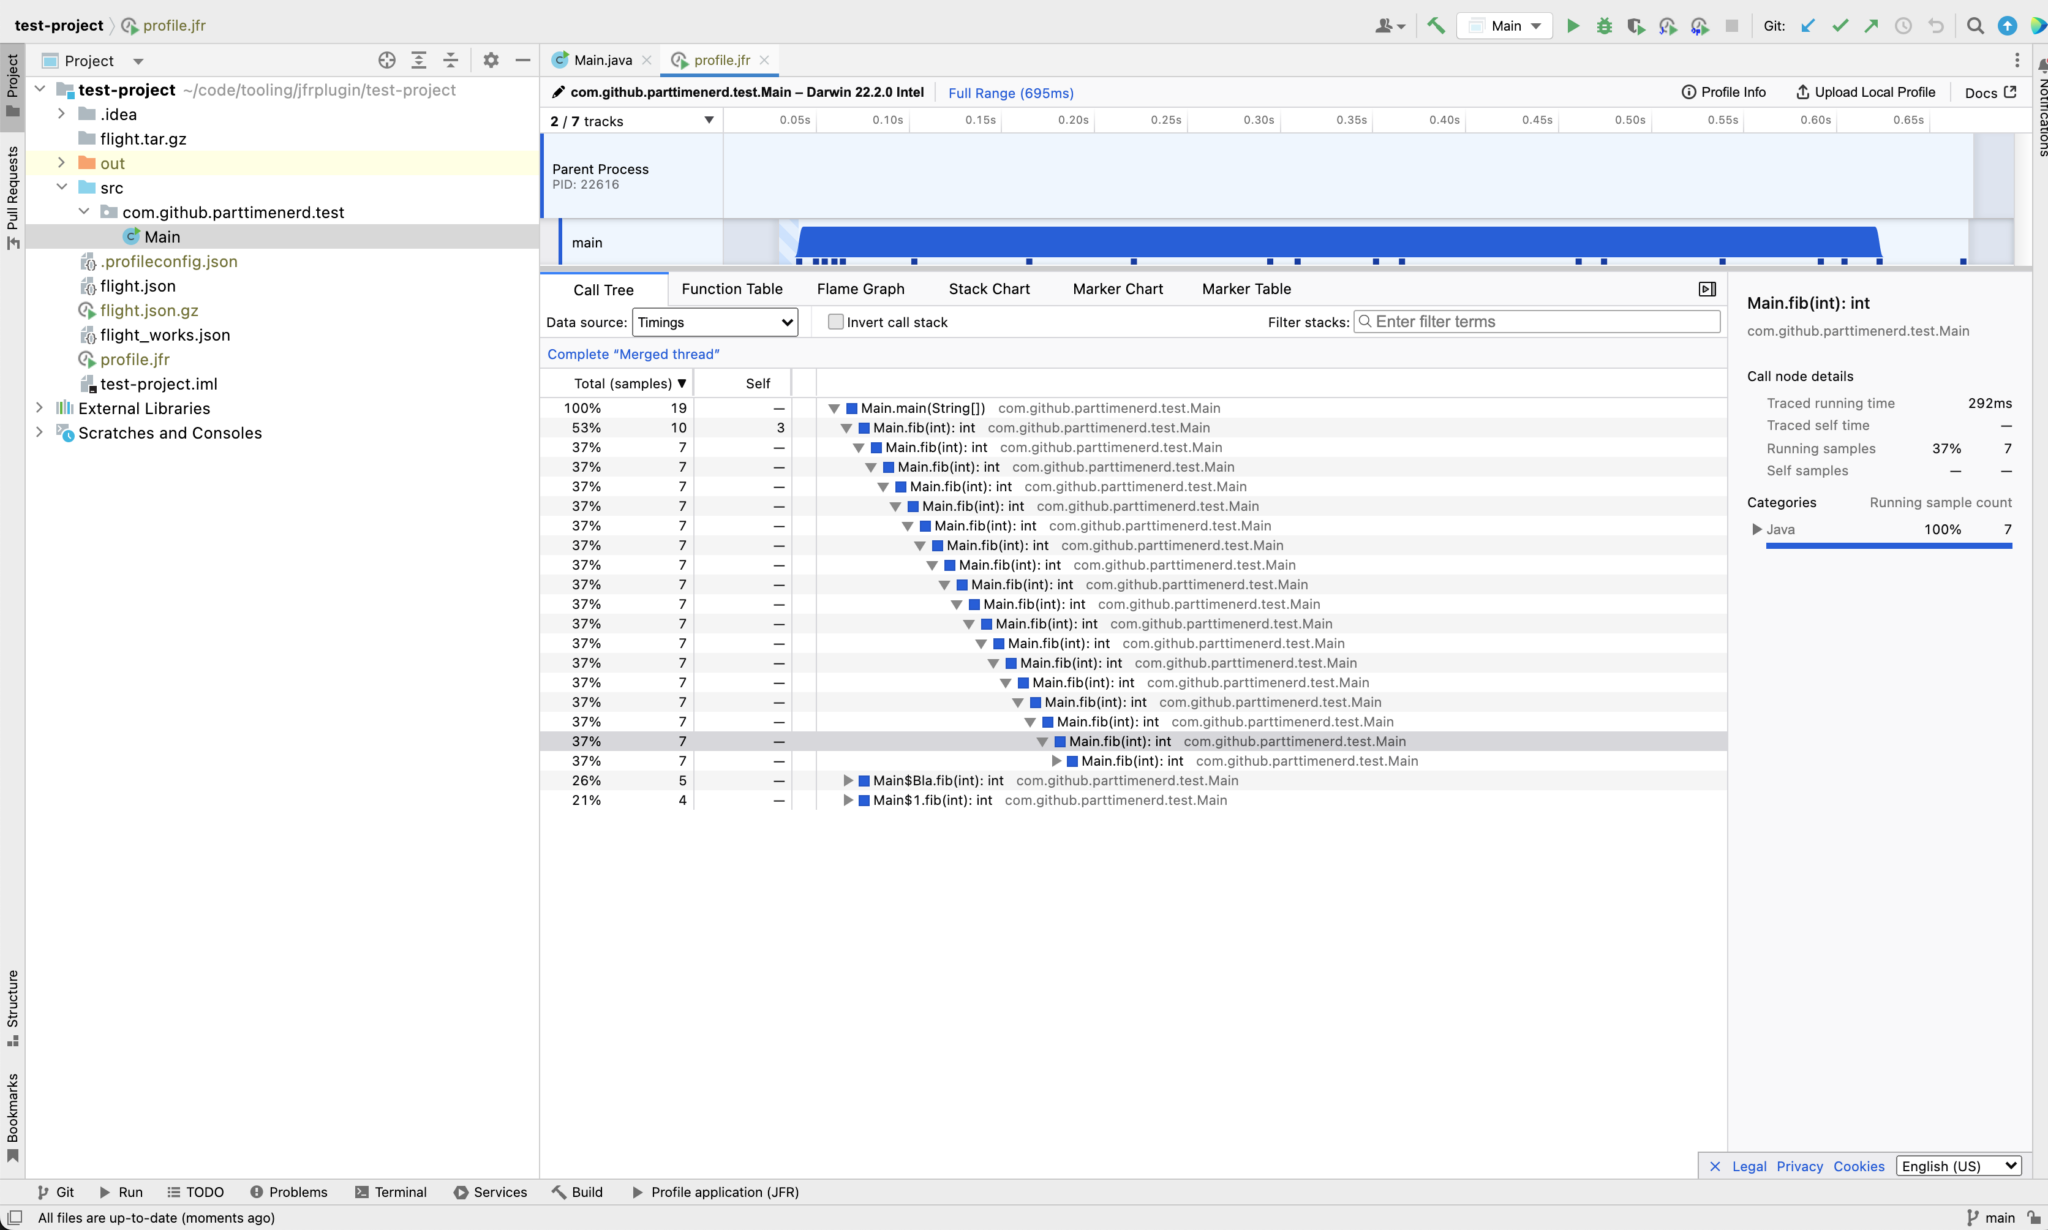
The "JFR Recording" tool window (View → Tool Windows → JFR Recording) lists all local JVMs. For each process you can start a JFR or async-profiler recording with one click and stop it when done — no restart required. The resulting JFR file opens automatically.
Opening any .jfr file shows it in the built-in viewer. You can switch between
Firefox Profiler and
Jeffrey using the dropdown in the editor toolbar.
Right-click a .jfr file in the project tree and choose Open with Jeffrey to open it directly in Jeffrey.
Jeffrey requires JDK 25+ on the host machine; Jeffrey UI is hidden automatically when not available.
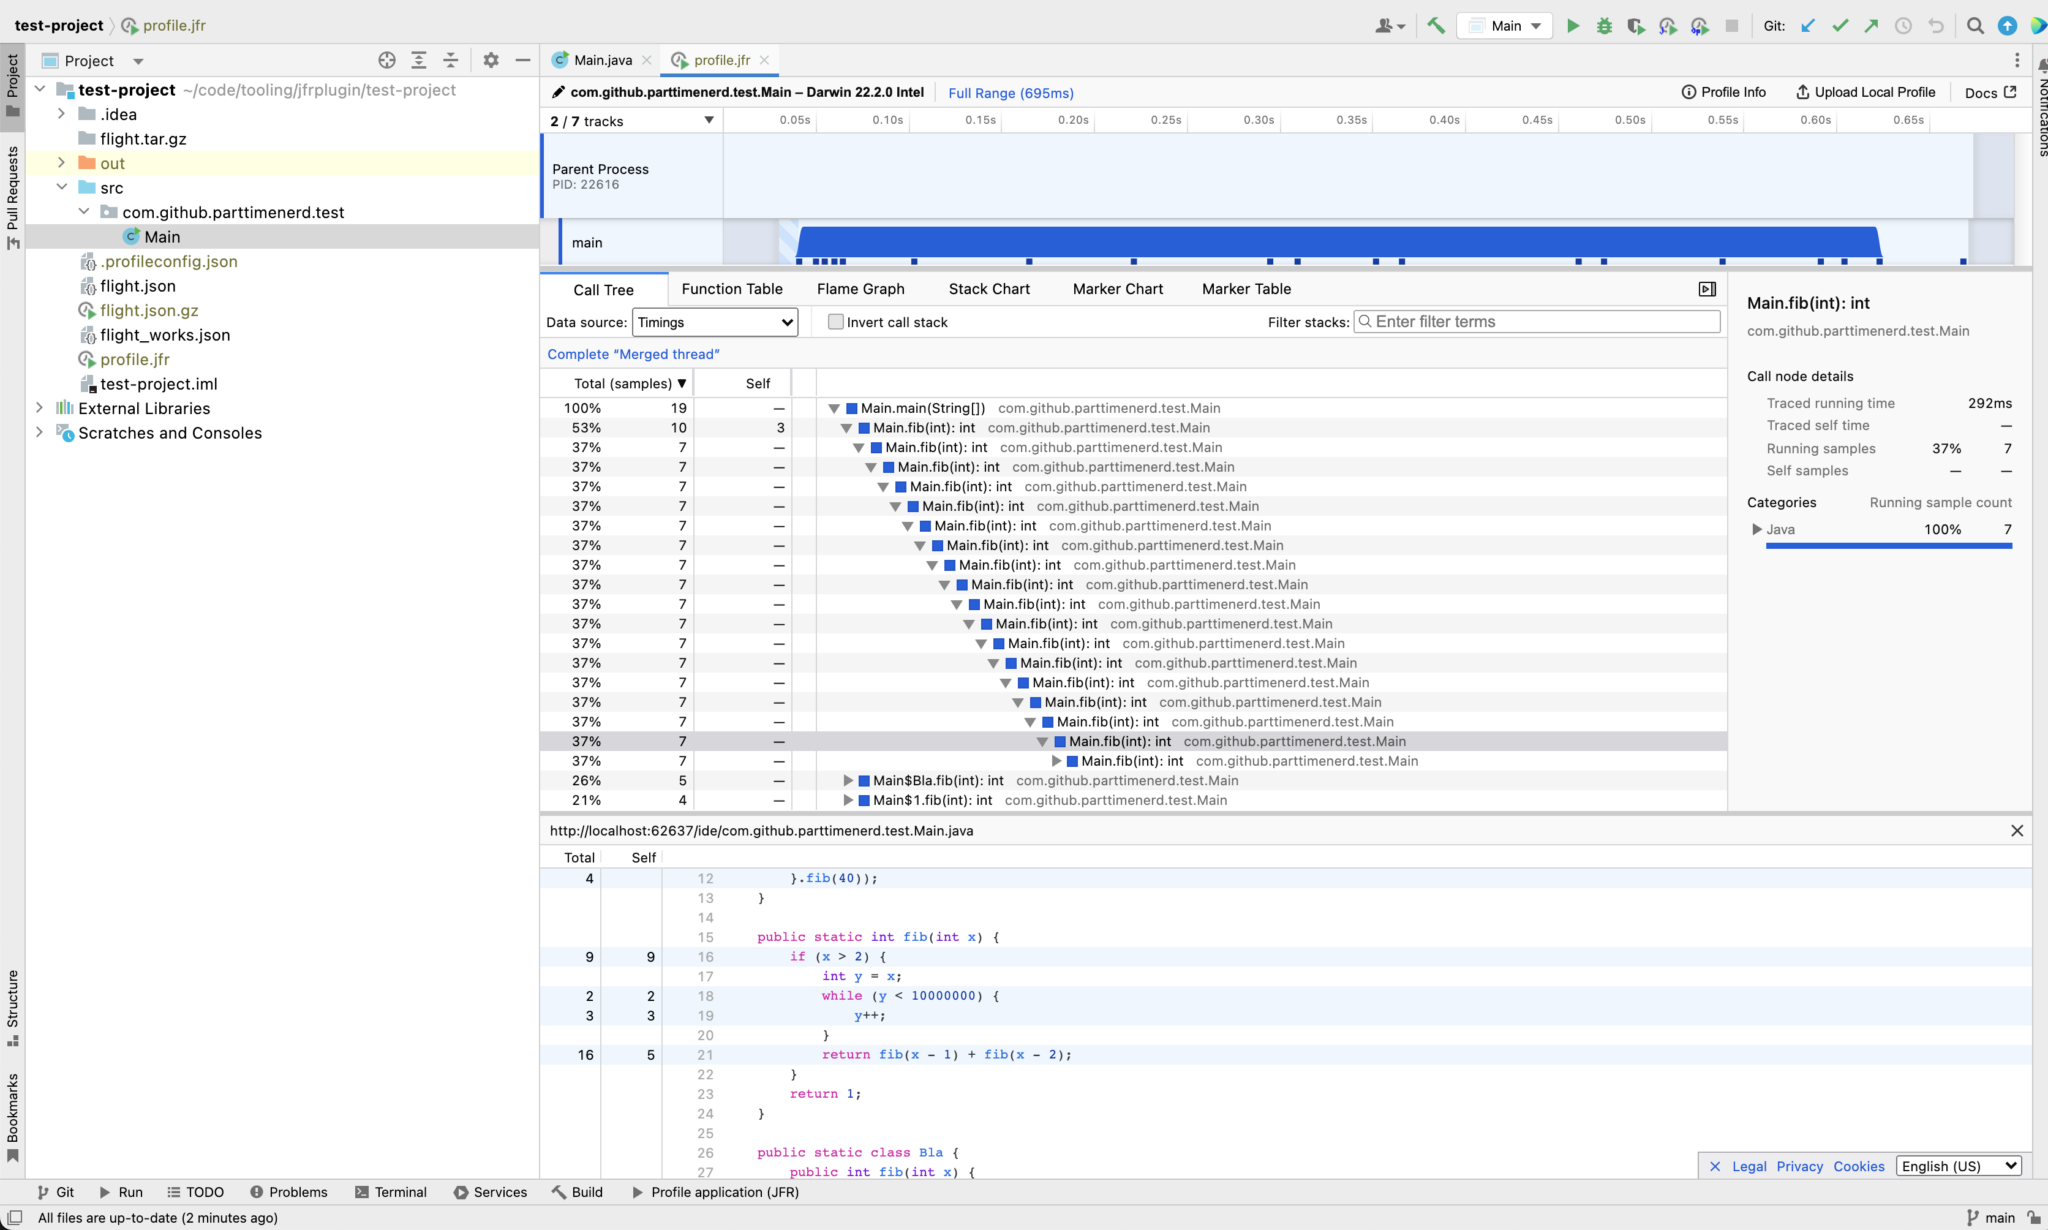
You can double-click on a method in the profiler to navigate to it in the IDE, or shift-double-click to view the source code directly in the profiler:
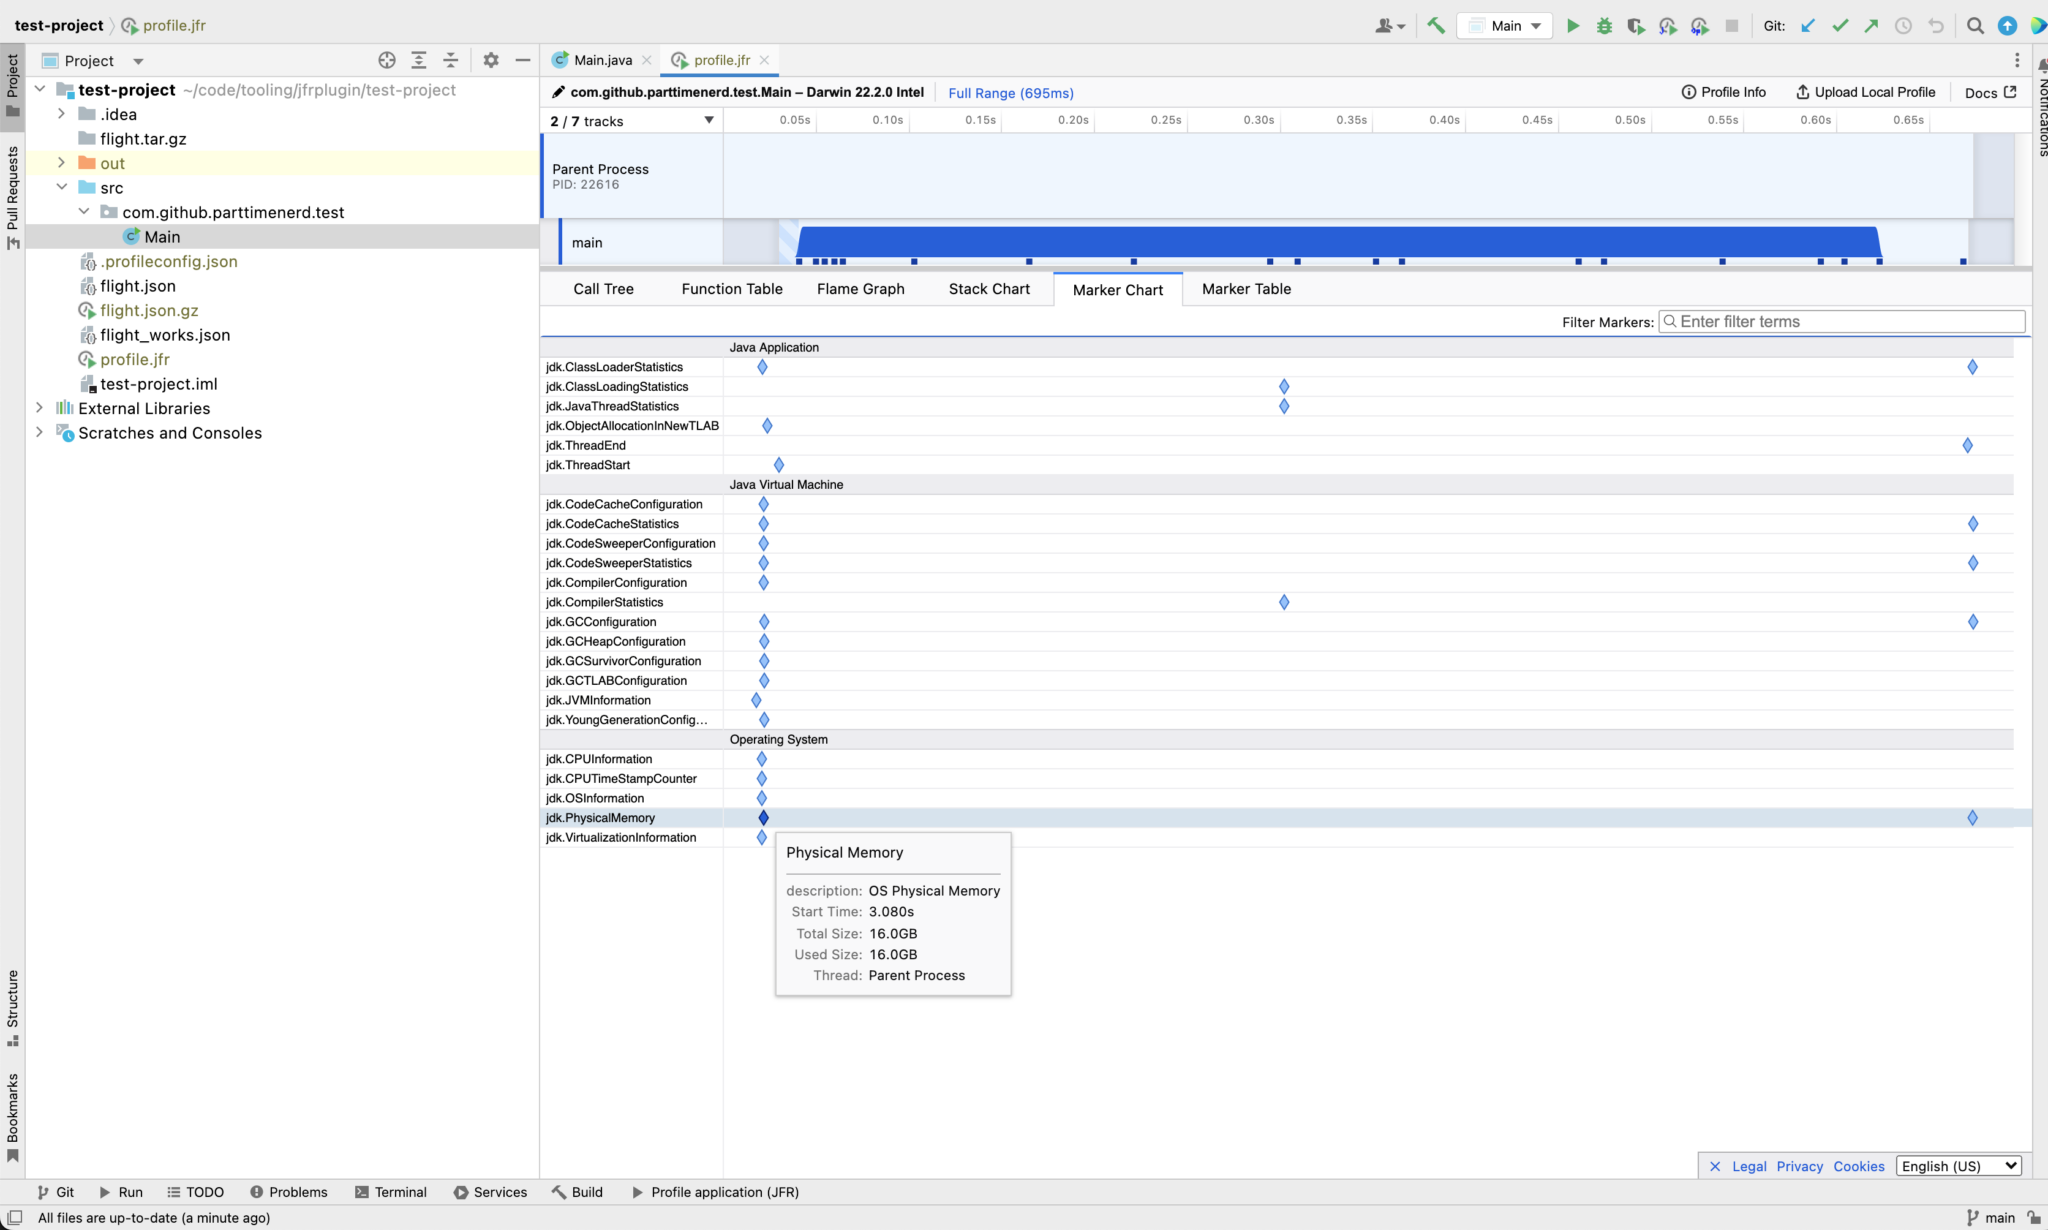
All JFR events are visible as marker tracks:
The plugin exposes a set of MCP tools that AI coding assistants (JetBrains AI, GitHub Copilot, Claude Code, and others) can call to interact with the profiler:
| Tool | Description |
|---|---|
profiler_list_run_configurations |
List all run configurations in the project |
profiler_run |
Run any configuration (app, test, Gradle task…) with JFR or async-profiler (ap:cpu, ap:wall, ap:alloc, …); opens the result automatically |
profiler_open_jfr |
Open a JFR file in the Firefox Profiler editor |
profiler_start_recording |
Start a JFR recording for a running JVM |
profiler_stop_recording |
Stop the recording and open the result |
profiler_navigate |
Navigate to a Firefox Profiler view (flame graph, call tree, …) |
profiler_get_status |
Report what is currently open and recording state |
profiler_get_hot_functions |
Return the top N hottest functions from the open profile |
profiler_open_function |
Jump to a function's source in the IDE |
profiler_jfr_view |
Run jfr view <view> <file> — tabular summaries: hot-methods, gc, exceptions, … Use view=help to list all views |
profiler_jfr_print |
Run jfr print --events <filter> <file> — raw event output for specific event types |
Requirements: IntelliJ IDEA 2025.2+ with the MCP Server plugin installed. The plugin continues to work normally without it — MCP tools are simply unavailable.
Available as Java JFR Profiler in the JetBrains marketplace.
You can also download a ZIP from the latest release and install it via Settings → Plugins → Install Plugin from Disk. Two variants are provided:
-full.zip— includes the Jeffrey profiler viewer (requires JDK 25+ on the host to use Jeffrey features; ~145 MB larger)-slim.zip— without Jeffrey; all other features work identically
The plugin is a thin wrapper around jfrtofp-server, which bundles the JFR → Firefox Profiler converter and a custom Firefox Profiler build with Java-specific features not yet upstream.
Async-profiler support uses ap-loader.
JVM attach uses the standard com.sun.tools.attach API and jdk.management.jfr.FlightRecorderMXBean.
Jeffrey is bundled as an alternative viewer and launched automatically.
MCP integration is an optional extension loaded only when the IntelliJ MCP Server plugin is present.
- run JFR or async-profiler on all Java run configurations with a single click
- attach to running JVMs without restarting
- be the bridge between simple built-in profilers and advanced tools like JDK Mission Control
- fully fledged analysis
- JDK Mission Control replacement